Opioid Crisis Data Exploration with R
Every year about 100,000 people in the United States lose their lives to drug overdose. The opioid crisis in our country has been a persisting issue for decades. Our goal with this project was to explore trends in opioid-related fatalities over a span of 19 years, from 1999 to 2017. Is ethnicity a major factor in drug overdose rates? What about age or gender? Can we discern which drugs were prevalent in different years? The CDC claims that this crisis has come about as a culmination of three distinct waves. First, in the 1990’s, prescription drugs such as painkillers became a prominent issue. Then, around 2010, there was a massive influx in fatal heroin overdoses. Finally, around 2013, deaths due to synthetic opioids such as fentanyl rose tremendously. Does the data provided by the CDC back up these claims? These are a few questions we are interested in answering.

I completed this project with my classmate Keerthi Srilakshmidaran in the Fall of 2023. Click the button below to be redirected to our project site, where we provide an in-depth analysis of our motivations and findings.
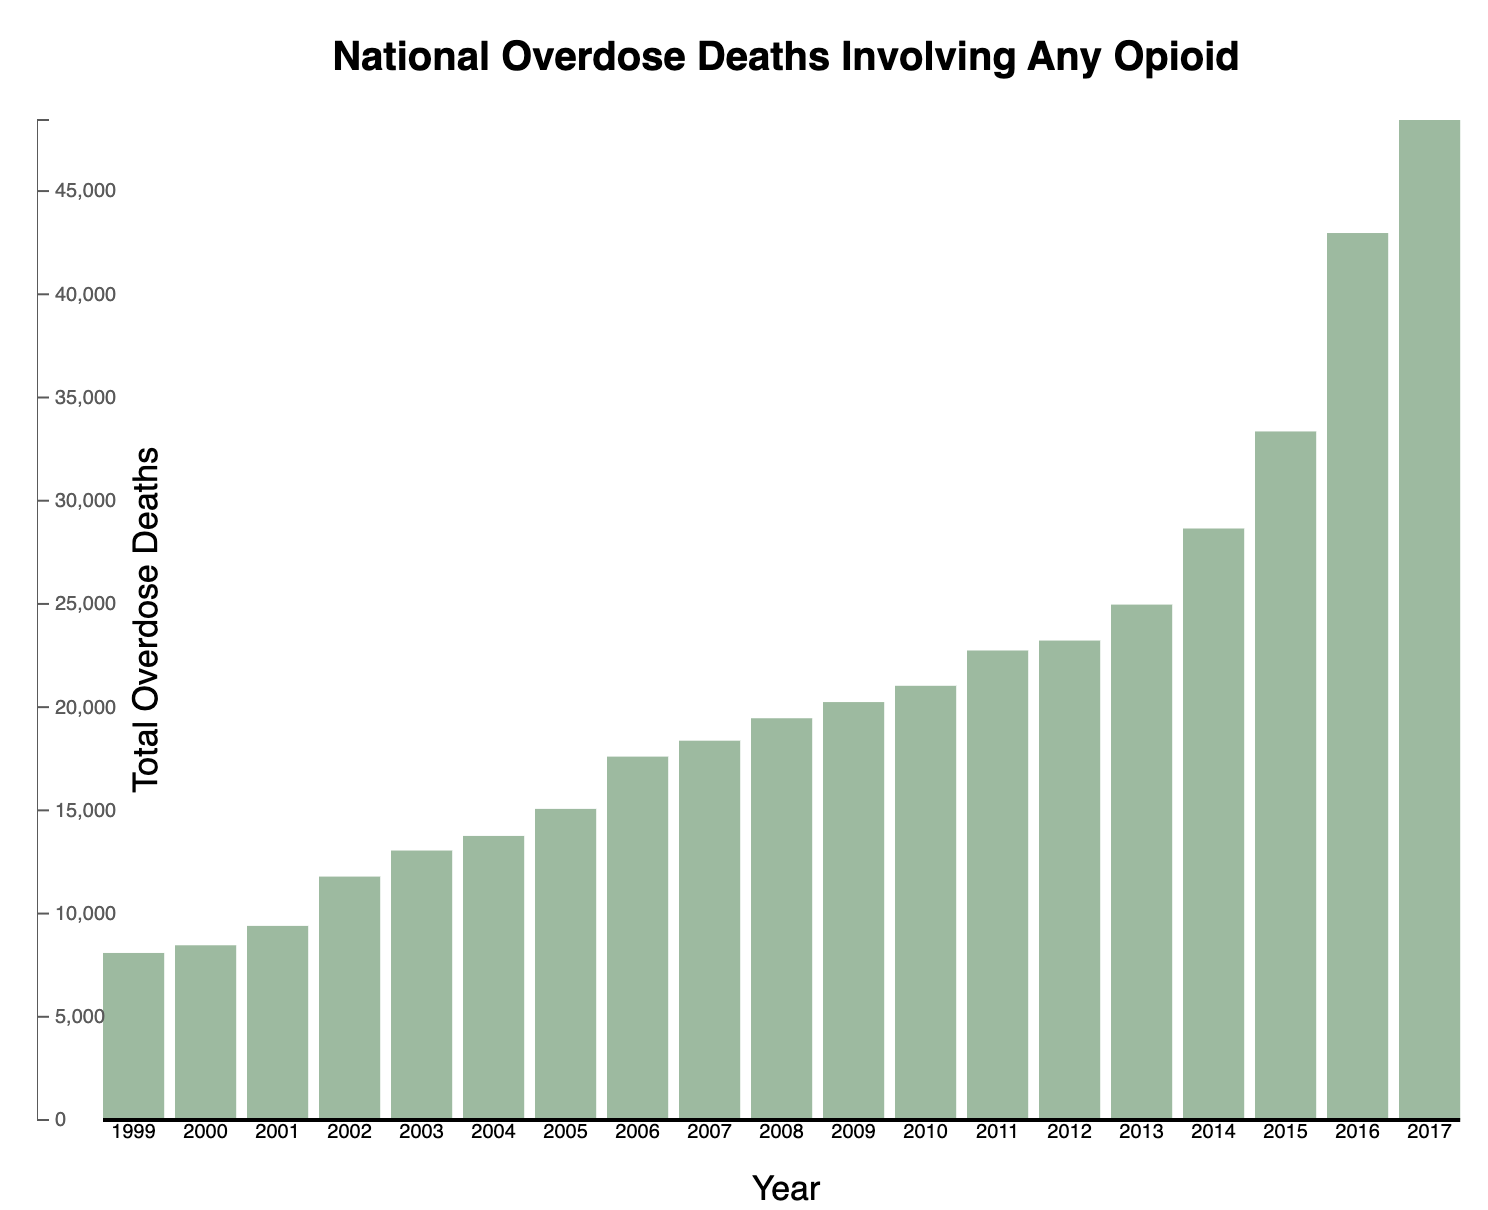
Below you can see a select set of graphs that illustrate our findings.